

Introduction
In today’s data-driven digital economy, web analytics is the cornerstone of success for any online business. Whether it’s a small-scale blog or a multinational e-commerce platform, understanding web analytics benchmarks is essential to evaluate performance, set realistic goals, and make informed decisions. Industry benchmarks for web analytics serve as a measuring stick, helping organizations compare their metrics with others in the same industry. This enables them to assess their online visibility, customer engagement, conversion efficiency, and content performance against established norms. As digital competition grows fiercer by the day, benchmarking ensures your web performance is not only efficient but also competitive. A solid grasp of these benchmarks allows marketers and decision-makers to fine-tune their strategies and focus their energy on areas that yield the greatest return. Please visit this.
Understanding The Importance Of Web Analytics Benchmarks

Web analytics benchmarks are comparative performance indicators that reveal how your website fares against others in the same sector. These benchmarks cover a range of metrics including bounce rate, average session duration, pages per session, conversion rate, and click-through rate. When these metrics are analyzed across industries, they uncover patterns, anomalies, and opportunities for improvement. For example, a 70% bounce rate might be acceptable for a news site but would be problematic for an online store. Similarly, an average session duration of under one minute might be expected for a reference website but would signal disengagement for a content-heavy platform. Benchmarks give context to your raw data, turning numbers into actionable insights. Instead of blindly interpreting analytics, benchmarks provide the frame through which you can determine whether a metric is satisfactory or needs attention.
How Benchmarks Vary Across Industries?
Web Analytics, Different industries exhibit vastly different web behavior patterns, which is why benchmarking should always be contextual. For instance, the e-commerce industry typically has a lower average bounce rate and higher pages per session due to users browsing product listings. On the other hand, blogs and media platforms may have higher bounce rates as users often visit to read a single article before leaving. Similarly, the average conversion rate is much higher in niche service industries than in highly competitive and generalized sectors. Web Analytics, Financial services websites often have longer session durations because users are navigating complex tools, while educational platforms see higher engagement rates due to in-depth reading material. Therefore, understanding the nuances of your specific industry is key to setting appropriate expectations and goals. Comparing a law firm website to an online retail site would provide misleading conclusions and could lead to poor strategic choices.
Key Metrics For Web Analytics Benchmarking
There are a few fundamental metrics that are universally monitored across industries. Bounce rate indicates the percentage of visitors who leave a website after viewing only one page. A high bounce rate might suggest issues with content relevance, site speed, or user experience. Average session duration measures the time a visitor spends on the website, offering insights into engagement levels. Pages per session reflect the depth of a user’s interaction with your content. Web Analytics, Conversion rate is one of the most vital metrics, showing how many users complete a desired action, such as a purchase or form submission. Click-through rate measures the effectiveness of links, ads, or CTAs, revealing how compelling your messaging is. Exit rate, which identifies where users are leaving your site, can point to friction in the user journey. By benchmarking these metrics, organizations can optimize their marketing funnels and boost ROI from their digital presence.
Global And Regional Differences In Benchmarking Data
Web analytics benchmarks are also influenced by geography. Users from different regions exhibit varied online behaviors due to cultural differences, digital literacy, and device preferences. For example, mobile usage is significantly higher in Asia and Africa, while desktop still dominates in parts of Europe and North America for certain business sectors. This affects session duration, bounce rate, and conversion metrics across the board. Web Analytics, language barriers, local content relevance, and payment preferences impact engagement and transaction rates. Businesses with global reach need to segment their web analytics data by region to derive meaningful comparisons. Without geographic segmentation, a company may misjudge the performance of its content or misallocate budget to underperforming campaigns. Regional benchmarking empowers marketers to localize strategies effectively and enhances the overall personalization of the user experience.
The Role Of Industry-Specific Tools And Reports
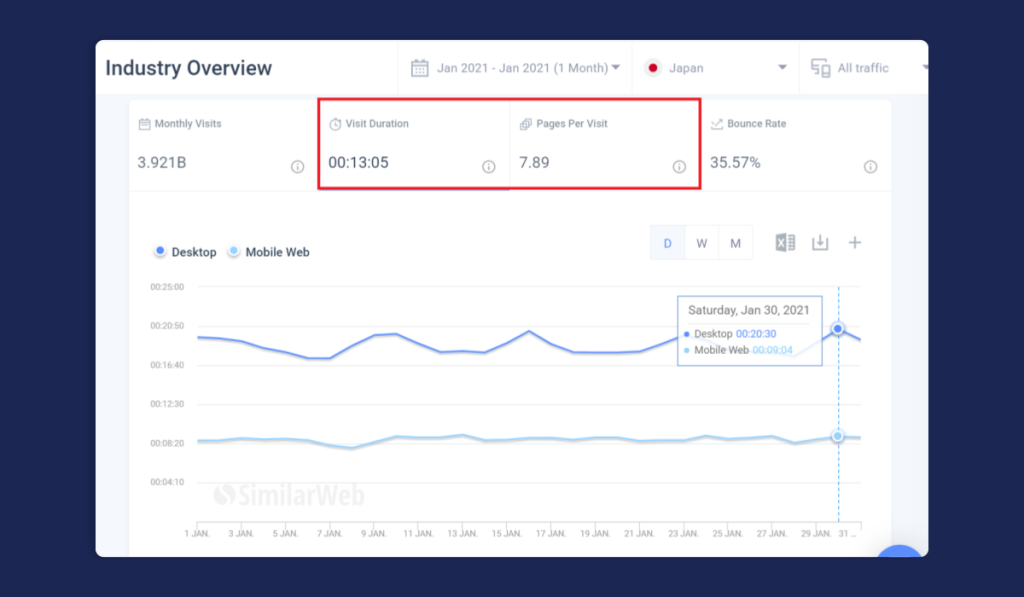
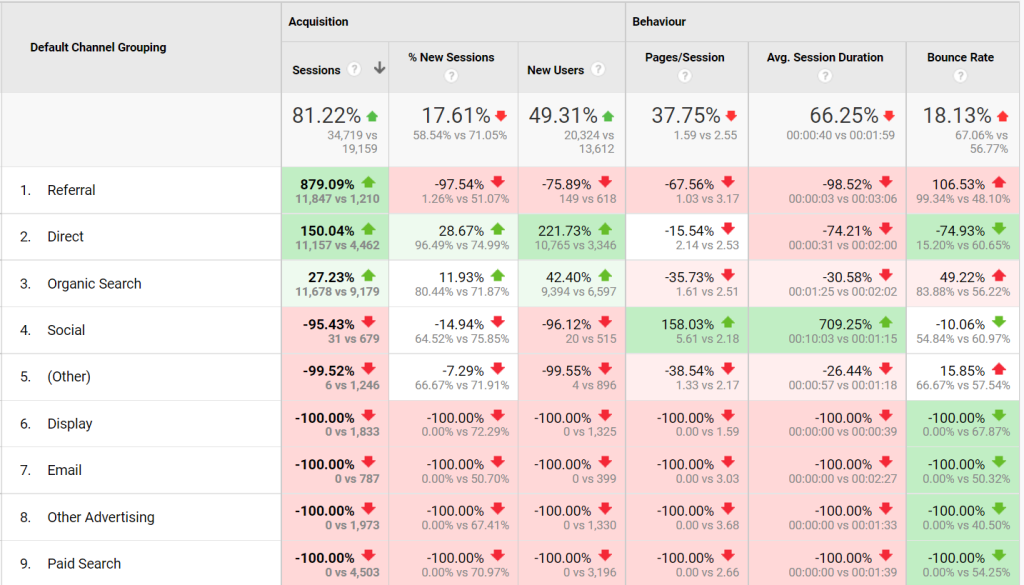
Web Analytics, To achieve accurate benchmarking, many organizations rely on third-party tools and industry reports. Platforms like Google Analytics, Adobe Analytics, and HubSpot provide general insights, but true benchmarking often requires access to aggregated data from tools such as Similar Web, SEMrush, and Stat Counter. Additionally, industry-specific studies from sources like Content Marketing Institute, Nielsen, and eMarketer regularly publish benchmarks for different sectors. Web Analytics, These reports consider factors like traffic sources, device usage, time-on-site, and user behavior patterns. For example, in the SaaS industry, a conversion rate of 7% might be average, while in the fashion e-commerce world, 2% could be considered strong. Having access to detailed comparative data enables more precise performance evaluations. Businesses can also participate in benchmarking surveys or join industry associations that share data anonymously to generate standardized performance metrics. The more tailored the data, the more powerful the benchmarking process becomes.
B2B Vs B2C Benchmarks In Web Analytics
One of the most distinct lines in web analytics benchmarks is drawn between B2B and B2C websites. B2B sites generally have longer sales cycles, leading to longer session durations and multiple visits before a conversion. Users may revisit pages like case studies, product specs, or demo booking forms multiple times before committing. This often results in higher pages per session but lower overall traffic and conversion rates. In contrast, B2C websites, especially in retail, focus on fast conversions and impulse purchases. They may see higher bounce rates due to price comparison behavior but often enjoy better click-through rates on promotions. Email marketing performance benchmarks also differ significantly. B2B emails might have a 20% open rate and 2.5% click rate, while B2C emails can perform better or worse depending on the industry and audience. Understanding the distinction between these two sectors is essential when applying web analytics benchmarks, as strategies must be tailored accordingly.
Mobile Vs Desktop User Benchmarks
Device type is another critical aspect of benchmarking web analytics. The shift toward mobile-first indexing has forced businesses to prioritize responsive design, site speed, and mobile UX. Mobile users tend to have shorter session durations, higher bounce rates, and lower conversion rates compared to desktop users. However, mobile traffic volume has overtaken desktop in many industries, especially retail, hospitality, and entertainment. Desktop users often show stronger intent and more deliberate browsing patterns, leading to deeper engagement. Web Analytics, Analytics benchmarks for mobile vs desktop allow businesses to segment their strategies based on user behavior. For instance, if your mobile conversion rate is significantly below the industry benchmark, it may be time to optimize your checkout flow or improve mobile site speed. Responsive design testing, mobile-friendly content, and simplified navigation are key factors influencing these benchmarks. By tracking mobile vs desktop trends, organizations can stay ahead of evolving user expectations.
Benchmarking User Engagement And Content Performance
Beyond traffic and conversion metrics, benchmarks also apply to content performance and user engagement. Time on page, scroll depth, social shares, and return visitor rates are all valuable indicators of how well your content resonates with your audience. For example, a benchmark time on page for a 1000-word blog post in the digital marketing space might be around 3 minutes. If your visitors are only staying for 1 minute, that suggests content might not be meeting expectations. Similarly, bounce rates on pillar pages or cornerstone content should be lower than those on landing pages. Content benchmarks can be used to inform content marketing strategies, refine editorial calendars, and prioritize SEO efforts. Using heatmaps and session replays can further illuminate user interaction with content, helping marketers to bridge the gap between user expectations and delivery. These benchmarks are particularly critical for content-heavy industries like education, publishing, and SaaS.
Using Benchmarks To Drive Optimization Strategies
Web Analytics, Once you’ve identified where your website stands compared to industry benchmarks, the next step is to use those insights for optimization. This could involve A/B testing your landing pages to reduce bounce rates, refining CTAs to improve conversion rates, or enhancing site speed to boost engagement metrics. Benchmarking helps prioritize efforts by highlighting the weakest areas. If your conversion rate is 1% while the industry standard is 2.5%, that’s a clear call to action. On the other hand, if your bounce rate is within industry norms but your session duration is lagging, that points to an issue with content depth or layout. Benchmarks eliminate guesswork and provide a data-backed foundation for strategic improvements. They serve as a performance compass, guiding decisions about design, copy, user experience, SEO, and marketing campaign structure. Organizations that integrate benchmarking into their optimization process are more agile and results-driven.
Caveats And Limitations Of Benchmarking
While benchmarking is undeniably valuable, it is not without limitations. One of the major pitfalls is overgeneralization. Benchmarks represent averages, and in some cases, they may not account for outliers or niche businesses. A company offering highly specialized services may not match industry norms in traffic volume but could still outperform peers in conversion quality or customer retention. Another risk is chasing benchmarks for the sake of it rather than aligning them with business objectives. Web Analytics, For example, reducing bounce rate is only meaningful if it contributes to user satisfaction and conversions. Additionally, metrics are subject to fluctuation based on algorithm changes, seasonal trends, and economic shifts. Blindly pursuing benchmarks without understanding their context can lead to misguided strategies. Therefore, it’s essential to treat benchmarks as guidelines rather than absolute goals and to combine them with qualitative analysis for a full picture of performance.
Benchmarking As A Continuous Process
Web analytics benchmarking is not a one-time exercise but a continuous process. The digital landscape is always evolving with changes in user behavior, technology, algorithms, and competition. What is considered a strong performance today might be average tomorrow. To remain competitive, businesses must revisit benchmarks quarterly or bi-annually, adjusting their strategies as needed. This involves tracking internal performance trends alongside external benchmarks, enabling an organization to evolve from reactive to proactive decision-making. Web Analytics, benchmarking encourages a culture of constant improvement. Teams stay motivated when progress is measurable, and stakeholders gain confidence when strategies are grounded in comparative data. It also fosters cross-departmental collaboration, with marketing, sales, UX, and content teams all using benchmarks to align their goals. In the long run, this discipline can help businesses not just meet industry standards, but surpass them.
Conclusion
Web analytics benchmarks serve as a vital navigational tool in the digital landscape. They help organizations contextualize their performance, recognize shortcomings, and chart a clear path toward improvement. From bounce rates and session duration to conversion metrics and engagement levels, benchmarks provide the standards by which success is measured. However, to extract real value, benchmarking must be tailored to the specific industry, region, audience type, and business model. It must also be updated regularly and combined with actionable insights. By integrating benchmark analysis into their ongoing optimization strategies, businesses can sharpen their competitive edge, improve user experience, and maximize ROI from digital efforts. In the fast-moving world of online business, those who benchmark wisely and adapt quickly are the ones who thrive.